Let's
begin by addressing the fundamentals: What is a Web graphic?
At
one level, a Web graphic is a digital
file, a collection of 1s and 0s that tells a browser to
display an image with a specific shape, size, and color. At another
level, it's
a form of communication (attention-grabbing,
organizational, or artistic) between you (the designer/producer)
and the viewer. The environment created
by graphics is intrinsic to the experience of using the Web. Just
think
of your favorite Web site devoid of any graphic content!
But
communicating on the Web has its own constantly changing rules. Improperly
produced or poorly designed graphics can make a Web site frustrating
and unpleasant, distracting users from the goals and mission of the
site. Web
graphic designers have a tough job—we need to create images
that are appropriate for these limitations and standards, in addition
to performing their job of visual communication.
If
we're lucky, sometimes we get the opportunity to push the limitations.
My philosophy, in a nutshell, is to make each graphic as efficient and beautiful as possible. This
is usually a give-and-take scenario involving a tradeoff between
file size and visual impact (the most efficient being the least beautiful
and vice versa). Achieving the best of both worlds is often a compromise,
but compromise doesn't mean necessarily mean sacrifice!
In the long run, learning to walk this fine line is the best way to serve the
interests of clients and Web users.
A
second global consideration (as you can see below) is the type of
site you're working on. Not every site will demand
cutting-edge image treatments, however much you love doing them.
The unique demands of each project should drive the type of
graphics you create.
 |
|
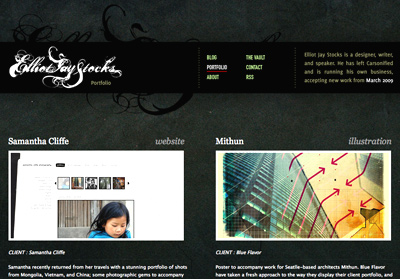
Pretty Picture. A site built for clients of a professional designer must pack a visual punch. |
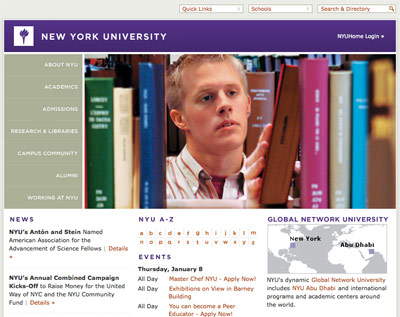 |
| No Frills. A site built to serve university students must project an organized, informational, and clean image. The focus is on content; graphics play a supportive role and help set the mood. |
Are you developing an e-commerce site? An editorial/news site?
A photographer's portfolio? In
each case, your approach should be different. The content on the
Web is certainly not homogenous, and users expect different experiences
from one site to the next. That means there isn't one formula to
creating the perfect graphic. But understanding your audience and
their needs will help you come up with a recipe that's appropriate
each time.
In
the following six lessons, we'll discuss the technical, production,
aesthetic, and design standards that make Web graphics great
and give your site's visitors the best possible viewing experience.
From the basics to some of the more esoteric issues, we'll tackle
such concepts as color systems, file formats, and optimization, and
come to understand terms and techniques such as vector, raster, dithering,
and anti-aliasing. We'll also look at good sources for materials
and examine issues of ownership. Not to mention, you'll create
many graphics using Fireworks in the following lessons.
Graphic Optimization
File
size is
a major consideration in most Web graphics projects. Even if you're just
creating a site prototype ("comp") for other team members to work with, you'll likely
be expected to save the individual graphics needed for the site
at acceptable file sizes.
File size is measured in
kilobytes, megabytes, or gigabytes (referred to
as
K, MB, and GB respectively). Every time you save an image for the
Web in Fireworks, the file size is displayed, so you can tweak
the image to reduce or increase its ultimate size. This process
of manipulating an image to obtain the optimal file
size is called optimization,
while the process of reducing a file's size is called compression.
We'll look at this process in detail in Lesson Three.
|
|
|
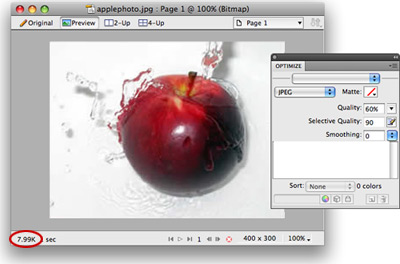
This image was optimized to a size of
8K using the Optimize panel in Fireworks and the File > Export
command. |
File
size is influenced by many factors. The image's
pixel dimensions (its
length and width in pixels), resolution (the
number of pixels per inch used to create the image on-screen), and
even the complexity of the artwork are all directly related to file
size. Another factor is the file format that you choose: generally
JPEG or GIF.
The file size represents how much disk space (or digital
"weight") is taken up by the image. When combined with the
user's connection speed, you get a sense for how long the user will
have to wait for
the image to appear on a Web page. (The more weight, the longer the wait.)
As
you can imagine, slow image loading is bad. Making the user wait,
and conveying a visual impression that the site is "broken,"
affects the user's perception of the integrity of the site. Web graphics
designers counter this problem by compressing file size as much as
possible, while keeping in mind the purpose of each graphic.
Here's
an example of this mindset. Suppose I am creating an informational site about Albert Einstein, with a graphic of the great man on the home page. My graphics folder for the site might look like this (below right):
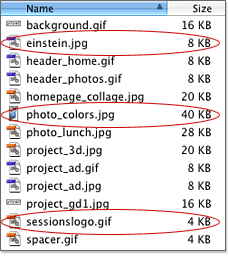 It's important for my site that users see the einstein.jpg photo before they move to a new page, so I kept it under 10K for super-fast loading. The logo JPEG also should appear immediately, so it's under 5K. The 40K file is an enlarged version of a photo that only very interested users will choose to see.
It's worth the minimal wait time to me and to them.
In general, larger file sizes should be reserved for special images that the user chooses to view, like zoomed-in product shots on an e-commerce site or a screenshot in your portfolio.
For
the impatient, goal-oriented Internet user, load
time can make or break your Web site. So, how
does this affect your graphics files and the choices you make when
creating and saving them?
The
answer is to make an artform out of optimization. The more detailed
and colorful the image, the larger the file size. The smaller the
file size, the more degraded the
image can appear. You'll want to reach a happy medium with file
size and image quality—your goal is to obtain the highest quality image with the lowest
file size possible. We'll go into great detail about optimization later in the course.
OK,
enough with the techie jargon. Let's see some optimized graphics
in action. This section is an overview of various kinds of Web graphics
you may come across—and be asked to create. We'll look at them
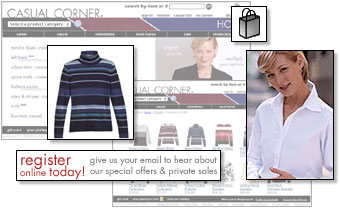
via a case study of a site I
produced a few years ago: CasualCorner.com, an online retail clothing
store. The company is now defunct, but the graphic concepts remain timely!
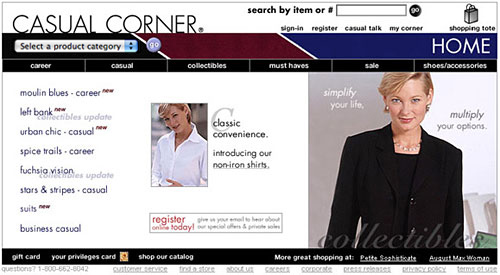 |
|
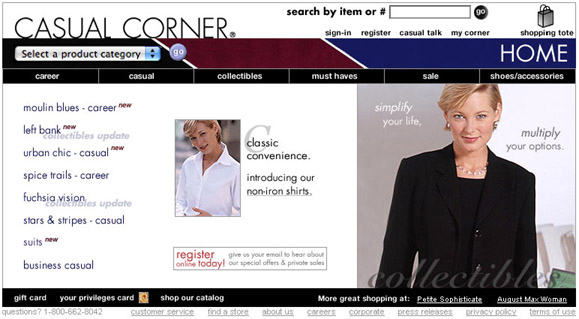
CasualCorner.com
home page. Click to enlarge. |
Since images exist within the larger context
of the Web site, it's important to make sure their place within
the
page
layout and site architecture makes sense. Think about what purpose
each image serves. What's the concept? What kind of information or
direction are you trying to convey? Remember that the function of
a Web graphic is not decoration but visual communication. Excessive "bells
and whistles" can
distract and annoy users—every image must serve a purpose.
You're going to learn techniques for each of the following
classic image categories as you work through the course.
Photographs
 |
This small
photograph is used as a teaser to attract attention to a promotion
on wrinkle-free shirts.
|
Photographic
images are
used across the Web to present realistic
snapshots of objects, landscapes, and people, taken digitally or traditionally.
Photographs can be used as-is, but are very often collaged,
manipulated, abstracted, or enhanced in Fireworks using special effects.
Still images, even a frame captured from video, are in this
category.
On
the CasualCorner.com site, photographs are used to showcase the clothing
and display how it looks in a realistic setting. This is a mode of representation
inherited from magazines and advertising. It's about creating an
experience around a product by representing it in a glamorous or
attractive context.
The
quality and content of such photographs can determine the success
of this site—they're the most important marketing tool this
site has. Never underestimate the power of the human face to communicate
a personality, adding life to the transactional e-commerce environment.
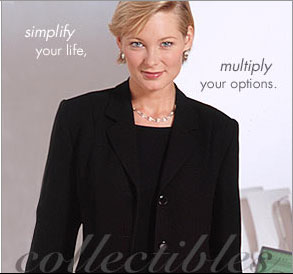 |
|
A photograph with text overlaid.
The function of this image is to communicate the target demographic
to the
site's
visitors: at a glance, visitors recognize the site is an
outlet for smart-but-casual women's clothing. |
Illustrations
|
Icons
such as this shopping tote are often illustrations. These
smaller images read more clearly as illustrations than
as photographic images.
|
Illustrations are
frequently used on Web sites to represent figures, icons, and hierarchical
elements. Non-photographic
art in this category can begin life as simple or complex creations
produced on paper, digitally, or with various other media. Line
art (images containing no shading or color gradations) is also a common
name for this approach.
One advantage of working with illustrations is that they oftentimes use fewer colors than
photographs, thus keeping file size low without losing much quality, as you'll
learn later.
Illustrations
can also look cleaner at small image sizes.
The
CasualCorner.com site isn't overflowing with non-photographic art,
but one example can be seen with the shopping tote. The image of
the shopping tote is there to give a personal touch and take away
some of the intimidation of shopping online. It can bring familiarity
to what could otherwise be an impersonal experience. In addition,
it makes the important "shopping cart" feature easy to
find.
Navigation
Navigation is
really a structural/architectural element, often created using
graphics. The overarching principle for navigation elements is
that they must be clear, consistent, and very prominent on a
Web site to guide users.
Navigation
is traditionally (but certainly not always) seen on the top or
left-hand side of a site; this way it's not likely to be hidden
in smaller browser windows. Navigation can be:
On
the CasualCorner.com home page, there's a lot going on, navigation-wise.
The architecture of this site was carefully planned out to simply
organize all of the information and create a visual hierarchy.
For global
navigation, a row of simple white-on-black graphic buttons (very
readable) appears on both the home page and product page:
 |
|
Global
Navigation. A subdued white on black for readability. |
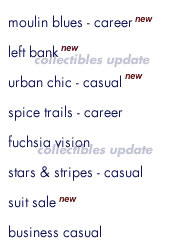
As
you get deeper into categories, the local or sub-navigation in
the left margin guides you smoothly, helping you find your way
and discover specific categories:
 |
|
Local
Navigation. No buttons here, but each chunk of text
is a separate image, some overlaid with "new" or "collectibles
update" labels to pique user interest. |
Thumbnails
Anyone
who's been to Amazon or Flickr knows what thumbnails are. Thumbnail
images are a representation or sample of other,
larger images. The small images can act as an index. Many times
they can be photographic, but other types of imagery can certainly
be used. Thumbnails can be used to show many items on a page at once,
by category or search results. Thumbnails are also helpful
in reducing file size (rather than using many large images).
On
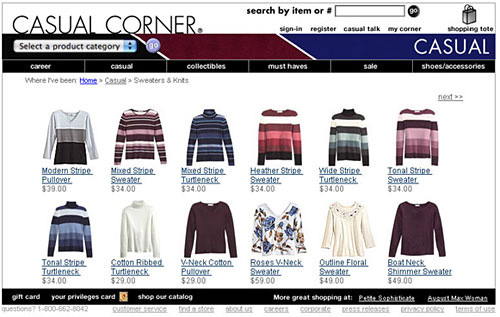
the CasualCorner.com product page for Sweaters and Knits, 12 thumbnail
results are displayed. When clicked, they each lead to a specific
product page showing a larger version of the image. Going through
the entry page, you can see many sweaters at once, rather than
having to click through 12 different product pages.
 |
|
CasualCorner.com product
page demonstrating thumbnails. |
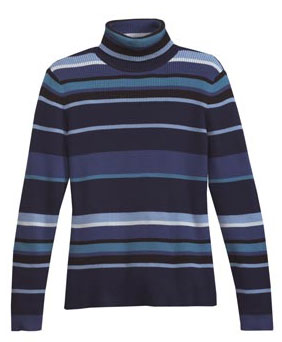
Notice
the difference image size makes to the Web user's impression of
the product. You'd certainly never buy the sweater based on
a thumbnail alone. But thumbnails give the user a quick preview of a series of items before
they choose to load a larger version.
 |
|
Larger
sweater image, deeper in the site. |
Text-as-Graphic
The
production decisions you make about how to build your Web site
will affect the look of the text.
If
you choose to create all of your site's text in HTML and CSS rather
than making it with graphics, you'll have a very efficient site with
fewer
stylistic
choices. On the other hand, treating text
as a graphic allows you
added flexibility with typography, fonts, and design. Even though
text conveys written content, there's no reason why it can't be
visually engaging! Logos are the most common type of "text-as-graphic" treatment,
as it's vital that a company's logo is represented in a specific
font, size, and color.
Text-as-graphic
treatments occurred many times on the CasualCorner.com site, but the
most critical application was the logo. To carry through signage
on the brick-and-mortar stores and print materials, the preexisting
logo and branding style had to be precisely represented on the
Web site.
 |
|
Text-as-graphic
Casual Corner Logo. |
Design
Elements
Design
elements are
Web graphics that may not have an informational
purpose, but can carry through the "look and feel" of
the site in interesting ways. They are used to enhance the general
appearance of a Web site and can also support the organization.
The treatment of the simplest thing—bullet points, rules,
arrows, and other elements—can play a role in directing
the eye.
To
draw attention to one example at the CasualCorner.com site, seasonal
colors were used above the navigation bar to enhance and emphasize
the color palette of the clothing. This area changes seasonally
along with the clothes.
 |
|
Design
elements are small touches that add to a site's look and
feel. |
Banners
Here's
a graphic category that's close to marketers' hearts. A banner (sometimes
called a tile) invokes a "call-to-action" in the viewer—to
buy a product, to visit a different Web site, to check out a special
promotion, and so on.
Many times these graphics are animated, interactive, or just bold
and attention-grabbing.
On
the CasualCorner.com home page, this banner was added to communicate
timely or important information, such as a promotion or special offer.
 |
Red
and Black. The
red communicates the call to action; the black, the
details.
|
OK,
we've gone through some fundamentals and seen how different
types of images work in a real-world example. It's time to look at the specific role Fireworks plays in Web graphics design.
Thanks
to the desktop revolution and the ensuing technology boom, we now have
a plethora of graphics tools, both software and hardware, that allow
us to manipulate visual elements on the Web.
Adobe
Fireworks is (in my opinion, shared by many throughout the design
industry) one
of the greatest—it's a versatile tool that has
definitely influenced the way many designers create Web graphics. It's not meant
to replace a favorite application like Photoshop, but rather to handle specialized
imaging tasks for the Web.
Understanding
the options, requirements, and capabilities of Fireworks
is the first step toward creating your own
style.
Fireworks' Role in Web Design
Fireworks has two different roles in Web design. The
first and most common role is the creation of individual graphics: a single
banner ad, a photo to be placed in a Web page, and so on. The second
is the creation of an entire Web page or Web site. Entire pages and
sites can be designed in a single Fireworks file, then exported and
uploaded to the Web.
Related to designing entire functional sites, Fireworks
can be used by designers to create site prototypes or "comps." Prototypes illustrate
to Web design teams how a finished site should look, and even include functional elements like clickable link and JavaScript behaviors. Working from a comp, team
members create individual graphics, additional page code, and other site features
in any programs that are preferred.
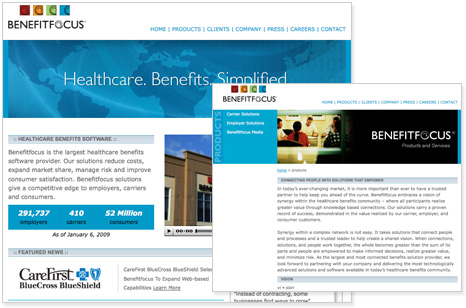 |
The designers at Benefitfocus.com use Fireworks to create graphics and interface prototypes. The prototypes are further coded with other technologies to create the complete Web site. |
So,
if Fireworks alone can be used to make a Web site, then how is it
different from Dreamweaver and other Web site authoring programs?
First off, all Fireworks documents are created on a canvas instead
of in
an
HTML
document.
The size,
color,
and resolution of the canvas can be controlled. Second, all objects
on the canvas can be dragged and dropped into various positions.
These objects are fixed only when a version of the file is exported
for the Web. Third, the objects you create (whether they are text,
shapes, photos, or lines) can be modified at any time inside the
Fireworks document.
These
three differences have caused Fireworks to be pegged as a digital imaging program, like Photoshop. But to lump Fireworks into that category
of software exclusively would be wrong. What some designers don't realize,
or remember, is that Fireworks can produce HTML and other Web files
in addition to being a graphics program.
Unlike
some other apps, Fireworks writes its HTML code
behind the scenes, exporting it along with the image files. When
you begin building a Web site outside Fireworks, you will have both
the image files and the code available to you, each in a separate
file. If you are one of those code-tweaker types, you will be able
to open the code inside Dreamweaver (or another program) and edit
away. But If you don't want to edit the code (or even look at it),
you don't have to.
How
does it work? Take a look at the image below. It shows a map of the
coffee shops in the downtown area of my hometown—a graphic
type you're likely to find on a tourism Web site.
Beside the map is a screenshot of the HTML code that will instruct
a Web
browser
to display the map inside the browser window. Both the map and the
HTML
were
created with Fireworks.
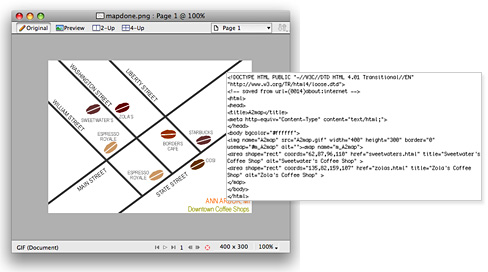 |
While you can deal with the
HTML directly, you certainly don't have to. Fireworks is glad
to do the work for you. |
The
process used to export the map graphic and the HTML will be outlined
for you later.
Fireworks took the lead in pioneering the PNG
file format (pronounced "ping"). Any file you create inside Fireworks
is saved as a PNG by default. Just as Photoshop saves its files
in a native PSD format, Fireworks
creates PNGs.
PNG stands for Portable
Network Graphics, and a PNG graphic can be viewed inside most recent
versions of Web browsers. PNGs can be more lustrous and beautiful than
your everyday GIF or JPEG without bulky file sizes, but don't swoon
over them just yet.
A
common mistake made by new Fireworks users is to publish native PNG files
directly to the Web. The Fireworks native PNG contains more information than your Web users need in a graphic, like the Fireworks layers and editable effects. Optimized PNG files, which do not contain this extra information, can be used effectively on the Web once properly exported from Fireworks.
By
the way, if you need a quick refresher
on GIFs and JPEGs, here's a quick way to remember their roles:
Unlike Fireworks native PNGs, GIFs, and JPEGs contain only the image
data you can see in your browser window. Typically you will save a native PNG on your hard drive for your original artwork, then export to GIF
or JPEG (or optimized PNG) for Web viewing.
You
are not limited to GIF, JPEG, and PNG formats when working with Fireworks.
You can also save or export Fireworks files in a variety of other formats,
such as SWF (Shockwave Flash), TIFF (used most often by print designers),
and even CSS (Cascading Style Sheets). Fireworks CS4 users can also export to PDF which is a great way to present a series of Web page prototypes in a single presentation.
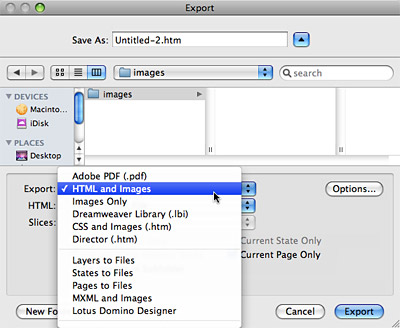 |
The File > Export window is full
of options. The ones you'll use most are "Images Only" and "HTML
and Images." |
Don't
worry if you don't know what each of those export options mean. It
will take you a while to learn them all and we'll cover the most
important ones throughout the course.

Canvas Size and Image Size
Eager
to get started? Let's delve into the Fireworks program itself, shall
we? Open up Fireworks and follow along with me.
The first thing you must do is create a canvas. The
canvas will serve as your work area and is the space onto which you'll place
all your objects. Most of the time, you will be creating objects inside Fireworks.
But sometimes, you might want to import objects from outside the currently open
document.
Choose File > New to
access the New Document dialog. This dialog
has two purposes: It allows you to set the canvas size and the canvas
color. You can always change these settings later, so don't get too
concerned about determining either of these things. Let's first talk
about setting canvas size.
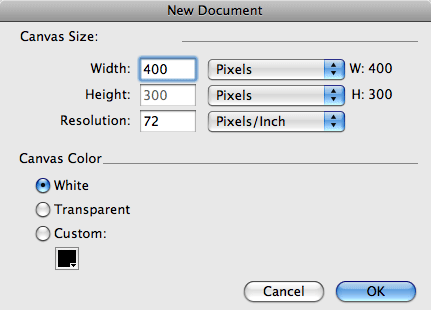 |
Start a new document (File
> New) using these settings. |
 Every
time you begin a new file in Fireworks, you will need to set the
width and height of your canvas. The unit of measurement is pixels,
by default. However, you can use the dropdown menus next to the
Width and Height field to choose a measurement unit of inches or
millimeters instead. I will use pixels as the measurement unit for
all the examples and exercises, as this is the standard unit of
measurement for Web graphics.
Set your new document to 400 pixels wide by 300 high. Additionally,
select White as the canvas color. This produces a white canvas that
fits nicely onto the viewing area of my
screen.
After
clicking OK, my blank canvas is
situated into the Fireworks environment.
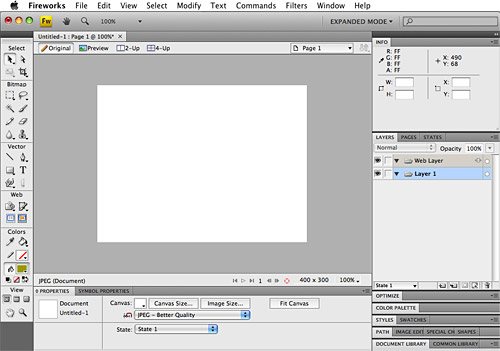 |
The white canvas is in the main document
window, tools are on the left, most panels are on the right, and the Properties panel is on the bottom. You
may see
different
panels on your screen. All panels are accessible in the Window
menu. |
If you have any experience at all
with computer graphics software, the
type of setup shown above will be familiar to you. The canvas
you just created is in the center of the screen, with a toolbar to
the left, and an opened Layers panel and Info panel to the right, and an opened Properties panel across the bottom.
If you don't see these panels, go to Window > Info,
Window > Layers, and Window > Properties to show them.
Let
me now bring your attention to the number one problem that
hangs people up at this point in the work process: the document view.
To
understand how the document view works, look first at the canvas.
Note how it is contained within a window. This window has some information
for you at both the top and bottom, but the most important thing
to look for is what percentage size you are currently viewing. In
the untitled document shown in above, the view is set to 100%, and
100% is indicated in the title tab (in Fireworks CS4) or title bar (in CS3). That means you are viewing the
canvas at actual size. CS4 users, you can click and drag the title tab so the window "floats" in the interface, changing the tab to a bar.
The
image below shows
a canvas that was created at 800 x 600 instead of 400 x 300. So,
why does it look almost identical to the image above when it is actually
double the size?
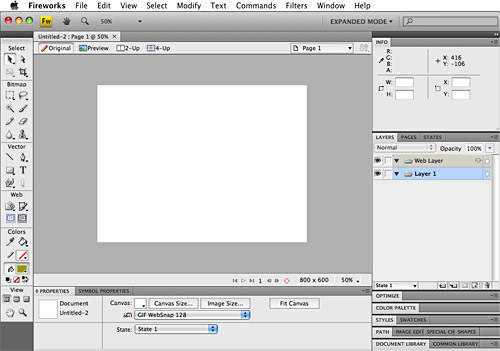 |
Look to the magnification
percentage in the title tab or title bar of the document window. Change it
in the View menu. |
 The
title in the 800 x 600 document reads "50%," so we're viewing
it at half of its actual size. If you create a document that is very
large, Fireworks displays it at a smaller size so that you can see
what you're doing,
and have
toolbars and panels open as you work.
You
can zoom in and out of your canvas at any time by going to the View
menu or by using these key commands:
|
|
Mac |
Windows |
|
Zoom
In |
Command
+ |
Ctrl
+ |
|
Zoom
Out |
Command
- |
Ctrl
- |
To check the resolution of a file, open it inside Fireworks
and go to Modify > Canvas > Image
Size. Inside the Image Size dialog, the
current resolution will be specified in pixels per inch. You can
change the resolution here as well as the image size.
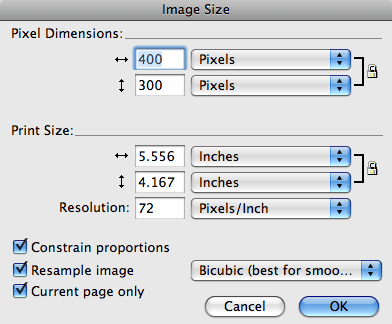 |
Keep your resolution and units of
measurement (pixels and pixels/inch) at these defaults for most
Web graphics. |
Note
that changing the image size is not the same as changing the canvas
size. To
understand why, open the A2map.png file from the course downloads area.
After
opening the A2map.png file, spend a moment or two hovering your mouse
over the canvas with your Pointer tool (the black arrow in the upper
left of the Tools panel)  .
Note that every object inside the canvas highlights as you move over
it.
Open your Layers panel if it is not already open (Window > Layers)
and take a look at the layers contained inside this document. There
are four layers, called Web Layer, text, street lines, and coffee beans.
We will be working with layers throughout the course, and we'll
talk about them more later. For now, click on the different layers in the Layers panel to get
a sense of how they work to organize the objects in your Web graphics.
Clicking each layer, you will see highlighted the objects that sit
on that layer. If you mess something up, choose File > Revert to
return the file to the stage where it was when last saved.
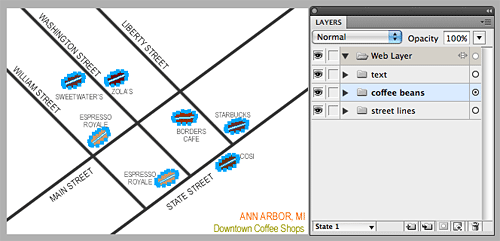 |
Here the "coffee beans" layer is
selected, highlighting all of the objects that live on that layer.
If you click the arrow next to the layer, you'll see each individual
item. |
Now,
go to Modify > Canvas > Image
Size. Change the Width field (horizontal arrows) from 400
to 300. Notice that the Height field (vertical arrows) will adjust
automatically
to 225.
(If this
doesn't happen, check the "Constrain proportions" box located in
the bottom of the dialog.) Once you have specified the new image
size
as 300 x 225, click OK and watch Fireworks reduce the entire canvas
and all the objects on it to the new, smaller size.
What
happened here is that the overall size of the image was reduced.
However, the resolution is still 72 dpi, as it was originally. Reducing
or enlarging the image size is something you will do frequently as
you adjust your graphics to fit into various areas of the Web browser.
Now,
choose Edit > Undo Image Size (or press
Ctrl/Command-Z to undo) to restore the image to a size of 400 x 300
before moving on. Be sure
to use Undo rather than go back to the Image Size dialog and change
the sizes—scaling an image up can sometimes result in quality
loss.
I
mentioned earlier that reducing the image size is not the same as
reducing the canvas size. Now you'll see why. With A2map.png open,
go to Modify > Canvas > Canvas Size.
Use the settings inside the Canvas Size dialog to change the
width (horizontal arrows) to 300, and the height (vertical arrows)
to 200. In the Anchor area, make sure the center square is selected.
This ensures that the canvas will be cropped equally around the entire
document. Click OK.
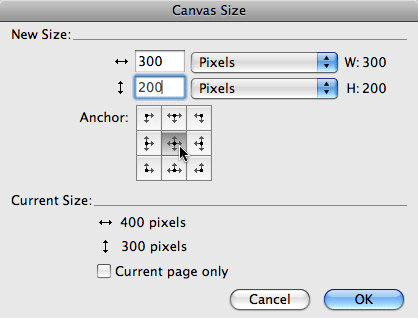 |
The Anchor feature specifies where
your artwork will be situated on the resulting canvas. |
Fireworks
will modify the document to display the new canvas size. This time,
the objects on the canvas will not be reduced. Instead of reducing
the overall size of the image, Fireworks has only reduced the canvas area,
and the resolution has not been changed. The areas of the objects
that don't fit into the new canvas area are chopped off and will
not appear in any exported versions of this file. However, they are
not lost forever. If you go back into the dialog by choosing Modify > Canvas
Size and reenter the settings to be 400 x 300 and click
OK, the canvas will enlarge to show all the objects on the screen.
Note that your Anchor must be at the
center square for this to work.
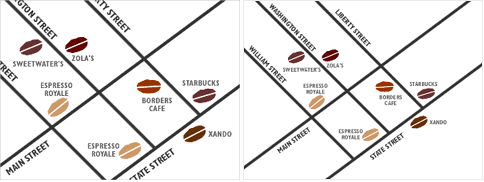 |
This image shows the
differences between reducing the size of the canvas (left) and
image (right) in A2map.png. |
Resolution
Now that you understand how to create a canvas, modify
it, and view it at an appropriate size, let's delve into another issue
that causes many people confusion: image resolution.
Every digital image can be measured in pixel size. The dimensions of
an image are the number of pixels found along its height and width
(400 x 300 for example). The dimensions combine with resolution, measured
in ppi (pixels per inch), to create the
size of the graphic that appears on the user's screen. The size that
your image appears on-screen is therefore determined by the pixel dimensions
of the image and the size and resolution settings of the user's monitor.
You may also come across the term dpi. Dpi stands
for "dots per inch" and refers to the resolution of print
images. A printer prints dots, not pixels, but the idea is the same:
the dots or pixels per inch, combined with the image dimensions, determine
the size of the graphic that prints or displays on screen.
Confusing enough for you? If all of those initials and
numbers start to blur, just remember this rule of thumb: All Web graphics should be set to 72 ppi, and this is the default in
Fireworks (another benefit of using Fireworks for Web graphics!). 72
ppi is standard for monitor display, although some monitors can display
at 96 ppi. Setting an image's resolution lower than 72 ppi can degrade
the quality, while setting it higher will waste space, causing larger
file size and longer download times.
So, besides remembering to always check the percentage
view in the title bar window, you must now remember to check your image
resolution before you begin unleashing your creativity onto the canvas.
Even though 72 ppi is Fireworks' default, you'll often work with files
you didn't make yourself or files that were created in programs other
than Fireworks.
Vector and Bitmap Imaging
The next big parameter to consider when manipulating
files is file category. Is the source file a bitmap or vector image?
Bitmapped (also known as raster)
images are made up of pixels found in a grid. The original file has
information (including location and color value) about every single
pixel. This can be likened to a piece of graph paper, on which each square is
filled with a different shade of color to create one large image.
Each individual square pixel is editable, as opposed to editing whole
shapes and objects.
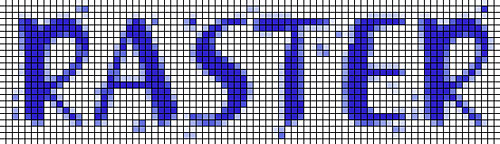 |
|
Hip to Be Square. Take a closer
look... a raster image is made up of little squares. |
This type of image file is best used to represent color
gradations and continuous tone images. The file sizes are heavier than
vector file sizes. This type of file would be appropriate if you're
working with photographic images, for example. Note that resizing (especially
enlarging) bitmap images can mean losing some of the quality of your
image since the data is "resolution dependent." This means
that if you increase the size of your bitmapped image, your graphics
may become blurry and out of focus.
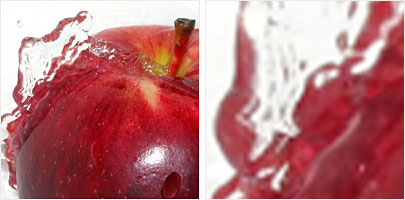 |
|
On the left, the actual-sized image, and on the
right, an "upsized" image. Notice the significant blurring
that occurs when upsizing a bitmap image. |
Vector-based images are
made up of various objects that the computer translates from mathematical
equations. Objects are shapes, lines, and curves that have various
attributes.
The application that opens this file type recreates the
image based on that mathematical information and therefore creates
a smaller file size with an image that appears cleaner when scaled
up or down. This type of file is better suited for graphics with crisp
lines or solid color areas. If you are creating an image that will
have to be scaled up and down many times (logos are a common example)
vector graphics would be more appropriate.
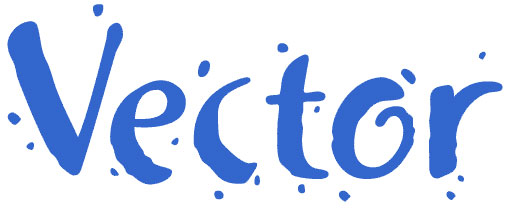 |
|
Smooth and Scalable.
The vector file's smooth curves can be resized at will. |
Fireworks can create and open both bitmap and vector-based
images. This is yet another plus in Fireworks' favor, as most other
imaging applications focus on a single image type.
Regardless of your source file type, the main file formats
for the Web (GIF and JPEG) are bitmap. When you export your file to
one of these formats, it will be converted to bitmap, if it is not already.
Even so, there are many occasions, such as with logos or navigation
button shapes, where you'll want to work with vector art tools in Fireworks
first before saving a bitmapped file for the Web.
Basic Drawing Tools
Do you still have your white, 400 x 300 canvas handy?
If not, start a new Fireworks document at 400 x 300 with a white background.
This canvas will give you an area to learn some tools.
By default, the Tools panel will appear on the left-hand
side of your work area. If you don't see the Tools panel, then go to Window > Tools to
open it. Now, take a good look at the image below, then move though
the tool definitions that follow, selecting each tool and experimenting
on your blank canvas.
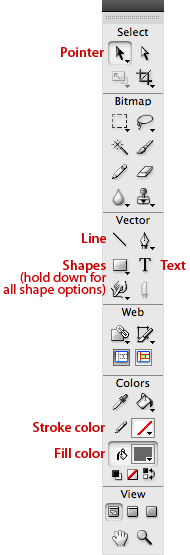
The Pointer tool is the most basic, fundamental tool
in the set. It is used to select and move objects on the canvas. Whenever
I ask you to select an object, you'll be using your Pointer.
Think of it as your cursor. Get into the habit of clicking the Pointer
as soon as you are finished using one of the other tools (you can switch
to it quickly by simply pressing the V key). You might have noticed
there is another arrow on the Tools panel located to the right of the
main Pointer tool. This white arrow, the Subselection tool, is used
to select points on vector shapes. Don't worry about experimenting
with it right now.
You won't be able to use the arrow on your current blank
canvas, because it doesn't yet contain any objects. So, move on to...
The Line tool is used to draw vector-based lines. Each
line you create with the Line tool can be modified in terms of color,
size, quality (soft or hard), and position.
Choose the Line tool and click and drag on your canvas
to draw a line. Here's a neat tip: Hold down the Shift key as you draw
to produce a perfectly straight line vertically, horizontally, or at
a 45-degree angle.
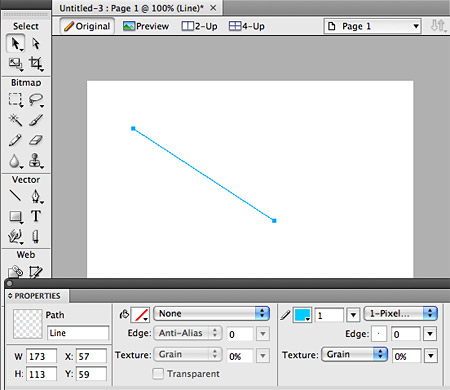 |
After drawing a line like mine, select
it with the Pointer and check out the Properties panel. |
To modify a line, you must select it with the Pointer
(or do not deselect after drawing) and open the Properties panel (Window > Properties).
The Properties panel (also known as the Properties Inspector) is where
many different types of objects on the canvas can be changed. Selecting
an object will show its available attributes in the Properties panel.
Choose the qualities you wish to attribute to your line.
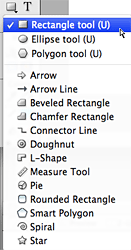 Now let's go beyond a simple line by adding a shape to the canvas. By default, Fireworks will display the Rectangle tool
icon in the Tools panel below the Line tool. Click and hold the Rectangle
tool to access the other vector shape tools in this set: the Rounded
Rectangle, the Ellipse, the Polygon, and many more.
Starting with the
Rectangle, choose each of these tools and draw one or more of each
shape onto your canvas. If you hold down the Shift key as you draw, the
shape will have even proportions.
To draw a shape, select the tool, click on the canvas,
and drag. If you don't like a shape you've made, select it and press
the Delete key.
Note that the shape you select will move to the forefront
in the Tools panel.
When using the Polygon tool, you can first select the
number of sides you'd like it to have in the Properties panel. Clicking
and dragging will draw a polygon with the number of sides you chose.
 |
Be sure nothing (except your Polygon
tool) is selected so you can see this option in the Properties
panel. |
Stroke and Fill Colors
The color (fill) and outline (stroke) of each shape is
determined by the currently selected color in the Fill and Stroke swatches
near the bottom of the Tools panel. Click the color swatch next to
the paint bucket icon to change the fill color, and the color swatch
next to the pencil to change the stroke color.
Select one of the shapes you just drew on your canvas
(remember, you must use the Pointer tool to select a shape). When your
shape is selected, move to the Tools panel and click the color swatch
located to the right of the paint bucket icon. Choose a color from
the palette that appears and observe how the fill of the selected shape
changes. Now, with your shape still selected, change the color of your
stroke by clicking the color swatch adjacent to the pencil icon. Once
you select a new stroke color, the selected shape's stroke color will
change.
To move up a level in your stroke and fill technique,
look to the the Properties panel. Use the options inside the panel
to create more interesting strokes and fills, even textures. Have fun!
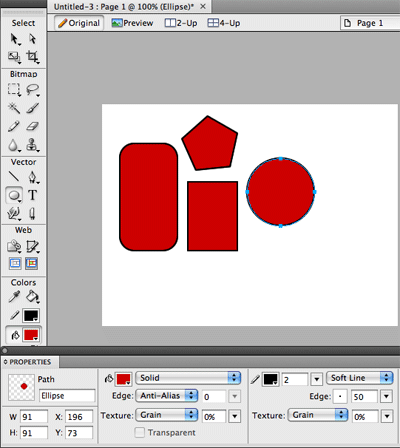 |
Fill and stroke colors are available
in both the Tools and Properties panels. Here I've increased the
thickness of my stroke to 2 pixels. |
Adding Basic Text
Another essential tool in Fireworks is the Text tool.
To add some text to your canvas, choose the Text tool and click inside
your canvas in the approximate area where you would like the text to
appear (you can move it later). Then type directly onto the canvas,
making stylistic changes in the Properties panel. To make such changes,
you'll need to select your text area with the Pointer tool, or highlight
the text with the Text tool like you would in a word processing application.
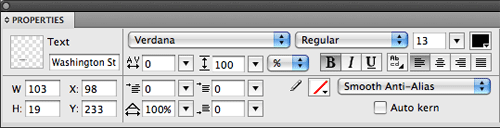 |
The options you'll
use most are the font, size, and color menus, but try your hand
at bolding, alignment, and other features. |
Use the Properties panel to format your text. Change your
font, size, color, and other attributes. (We'll look at these in greater
detail later in the course.) Experiment with the alias and anti-alias
features. Anti-aliasing produces smoother text, but it's more difficult
to read very small anti-aliased text.
Just like with shapes, you can use the Pointer tool to select
the text box and move the text within the canvas. Clicking and dragging
the text box handles will rearrange the breaks inside the text box.
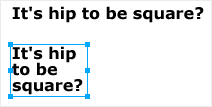 |
Drag with the "handles" around
the text to resize the text box. |
You can always edit your text, even after you place it
on the canvas. Double-click the text block with the Pointer tool, or
single-click the text block or anywhere in the canvas with the Text
tool.
Duplication and Transformation
Text and any other objects in a Web graphic can be duplicated
as needed as well as transformed.
Duplicating an object is as simple as copying and
pasting in Word processing programs. Select an object with the
Pointer tool and press Ctrl-C (on a PC) or Command-C (on a Mac), or
use Edit > Copy. This copies the object
to your clipboard. To paste the copy onto your canvas, press Ctrl/Command-V
or go to Edit > Paste.
The copy will appear directly over your original, so
you'll need to drag it with the Pointer to see and position it. You
can now do anything you'd like to the duplicate without affecting the
original, like adding a fill color.
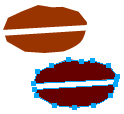 |
| I duplicated my coffee bean object
many times for use in the map. |
 Objects
that you create can be transformed to adjust their size or rotation.
They can even be intentionally distorted. To scale an object, use the
Scale tool
 or
go to Modify > Transform > Scale.
This will place a bounding box around the selected object. You can
then click and drag the handles of the box to change its size. If you
hold the Shift key while using a corner handle, you'll maintain the
proportions of the object while sizing it. You can skew and distort
your objects using a similar process. The Skew and Distort tools are
found under the Scale tool or in the Modify > Transform menu.
 Rotation is also found in the Modify > Transform menu.
You can use it to rotate an object by 90 or 180 degrees, or flip an
object vertically or horizontally. For more custom rotating, you can
choose your Scale tool and hold your mouse a little away from a corner
handle so that you see a curved arrow cursor. When you see this, click
and drag to rotate the object.
Creating and Linking Hotspots
 After
you have created a canvas with some experimental shapes and text, you
can go a step further by creating Web links. When you export your graphic
and HTML later, the links will be clickable.
You can use Fireworks to create links to other Web sites
or other files inside your own Web site. There are many different ways
to create links, but for this example we will use the Hotspot tool.
Select the Rectangle Hotspot tool from the Tools panel,
and use it to draw a hotspot over any area of your canvas you wish
to link. The hotspot will be represented by a shaded area. (All hotspots
and slices and placed on their own layer, called the Web Layer, in
your Layers panel.)
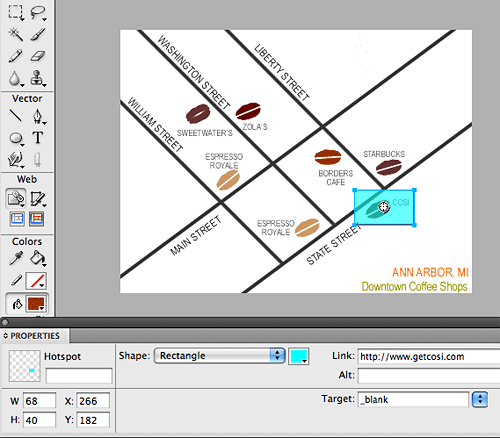 |
On my map of coffee joints, I've
added a hotspot and linked it to the home page of the respective
coffee shop. |
With the hotspot selected, look towards the Properties panel—this
is where you'll type the URL to which the hotspot will be linked. The
URL is typed into the Link field. Remember to type the entire URL,
including the http:// prefix (if you are linking outside your own site).
If you want your link to open inside a new browser window, use the
Target pull-down to choose the _blank value.
There is no limit to the number of hotspots you can make,
or the variety of shapes you can use to make them (hold down the tool in the Tools
panel to see more choices), but keep things neat!
Exporting Images and HTML
Once you have a completed version of your linked image,
save the file in PNG format with the File > Save As command.
(Of course, you should be saving your work as you go along.) Save
your PNG file into a personal folder on your hard drive that you will
remember. Once you have saved your PNG, you can export a version of
it for the Web.
 With the PNG open, click the Preview button at the top
of your document window. Open the Optimize panel (Window > Optimize)
and choose one of the default settings at the top of the panel. Until
we discuss optimization strategies later in this course, use GIF Adaptive
256 for line art images like the one you created here, and JPEG-Better
Quality for photographic images.
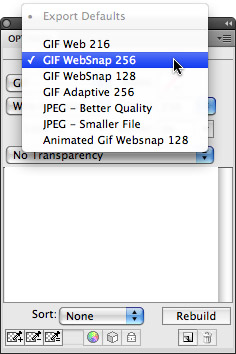 |
| The defaults
are handy for quick exporting. Just check how the image looks
in your Preview view before export. |
Now that you've chosen a file type for your image, you
can export. Choose File > Export to access
the Export dialog. Inside the Export dialog, specify what you want
to export and where you would like the files to be saved. In this case,
you will be exporting a single image file (in the format you chose
above) and an HTML document that will contain the hotspot link(s) and
a reference to your image file. This way, you can publish your map
to a Web site.
Below you can see how I exported my map and HTML document.
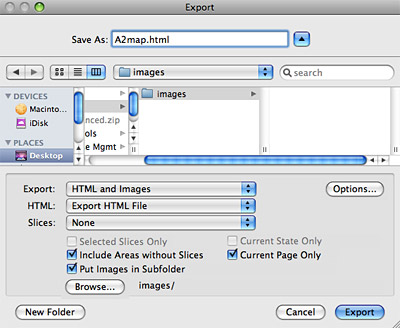 |
Your settings
might be slightly different—it all depends on how your
folder structure is set up on your hard drive and your Web server. |
I chose to put my map image in a folder apart from the
HTML file. To do this, I clicked the "Put Images in Subfolder" option
and browsed for my Images directory. It is pretty much standard practice
in Web development to keep images and HTML files in separate folders. It keeps
things more organized as your site grows.
I also chose to modify the HTML extension from the Fireworks
default—changing it from .htm to the more standard .html (both
work just fine, though). This is accomplished by clicking the Options
button inside the Export dialog.
After reviewing your Export options carefully, click
Save to export the files. Now it is time to view the results of your
hard work inside a Web browser.
Open a Web browser, and choose File > Open.
Browse for the HTML document you just created inside Fireworks. Once
the page is loaded in, take a look at the HTML code by choosing View > Source (or
whatever command your particular browser has for viewing the HTML code
of a currently loaded document). This HTML was composed by Fireworks,
and you can do whatever you want with it.
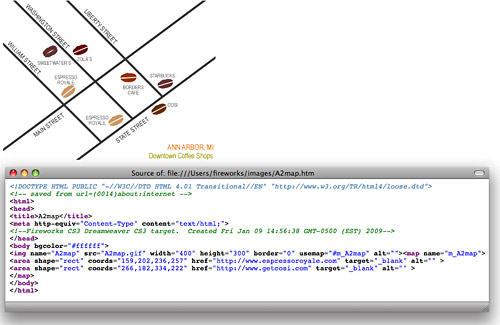 |
This shows my map and HTML page as
they appeared in Firefox. Note that the map image is referenced
inside the HTML as src="images/a2map.gif." Click to enlarge. |
If I wanted to publish this map to my Web site, I would
use File Transfer Protocol (FTP) to move the HTML file and the map
image to my Web host. I use the FTP program built into Dreamweaver to
send my files to the Web, but there are lots of standalone FTP programs
as well.
In this lesson, we covered the basics of dealing with images in
the Fireworks environment. These basics are fundamental
to your success in this course, and with Fireworks in general. As we
progress through the course, we'll look at many more complex Fireworks
techniques as well as delve more deeply into aesthetics of
Web graphics.





 Get an overview of the process of Web graphic design.